|
Source: ISI Web of Science, 2014
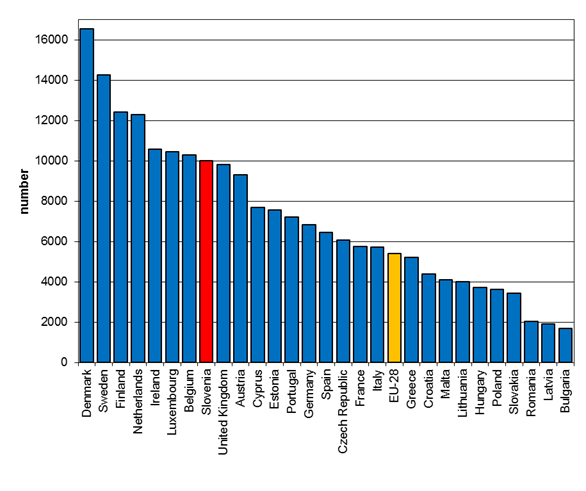
Number of Scientific Papers per Million Inhabitants
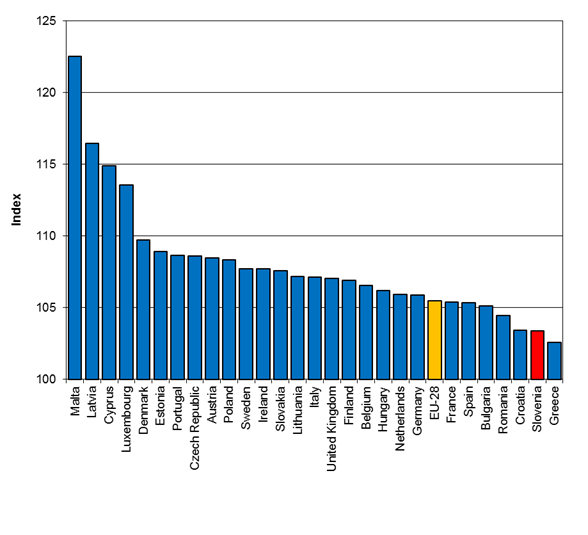
Number of Papers and Index of Papers
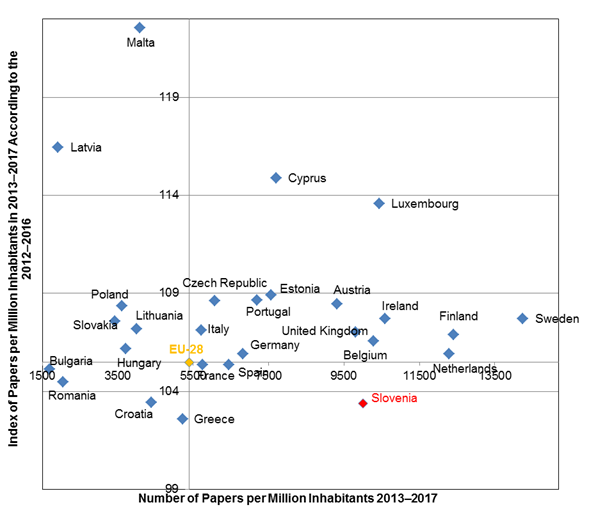
Number of Papers per Million Inhabitants, 2013
- 2017
Index of Papers per Million Inhabitants in 2013–2017
according to the 2012–2016
Number of Scientific Papers per Million Inhabitants

Number of Papers and Index of Papers

Number of Papers per Million Inhabitants, 2012
- 2016

Index of Papers per Million Inhabitants in 2012–2016
according to the 2011–2015
 Data for Croatia is included, even
though Croatia was not a member of EU in the period 2009-2013.
Number of Publications per Million
Inhabitants
Number of Publications and Index of Publications
Number of Publications per Million Inhabitants 2009–2013
Index of Publications per Million Inhabitants in 2009–2013 according to the
2008–2012
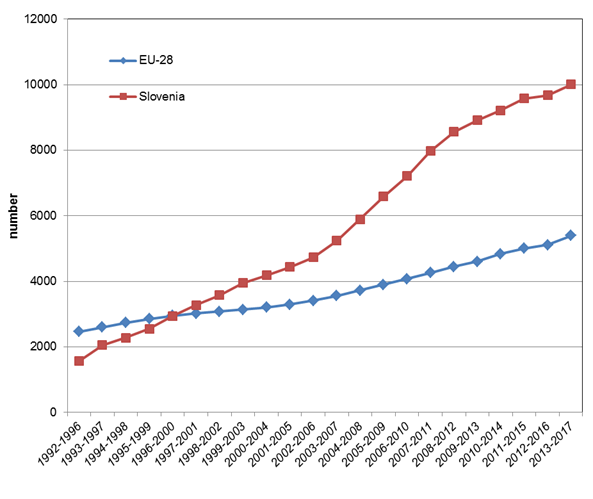
Time Matrix for Publications per Million Inhabitants in 5-year Periods
Time matrix is an innovative complementary approach showing time series using
the principle of time distance, as developed by prof. dr. Pavle Sicherl. 5-year
period where the indicated year corresponds to the end of the period, this means
that the year 1997 represents 1993–1997 and 2013 represents 2009–2013.
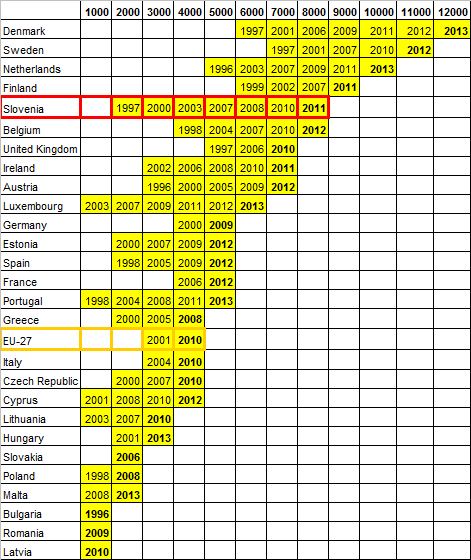
Source: ISI Web of Science, 2013
Number of Publications per Million
Inhabitants

Number of Publications and Index of
Publications

Number of Publications per Million
Inhabitants 2008–2012

Index of Publications per Million
Inhabitants in 2008–2012 according to the 2007–2011

Time Matrix for Publications per Million
Inhabitants in 5-year Periods
Time matrix is an innovative complementary
approach showing time series using the principle of time distance, as developed
by prof. dr. Pavle Sicherl.
5-year period where the indicated year corresponds to the end
of the period, this means that the year 1997 represents 1993–1997 and 2012
represents 2008–2012.

|